Difficulty in all provinces of the country house rankings released three consecutive years topped | country | Beijing _ Beijing News
Original title: real home buyers all over the House price-income ratio ranked in 30 province-baked hard bottom
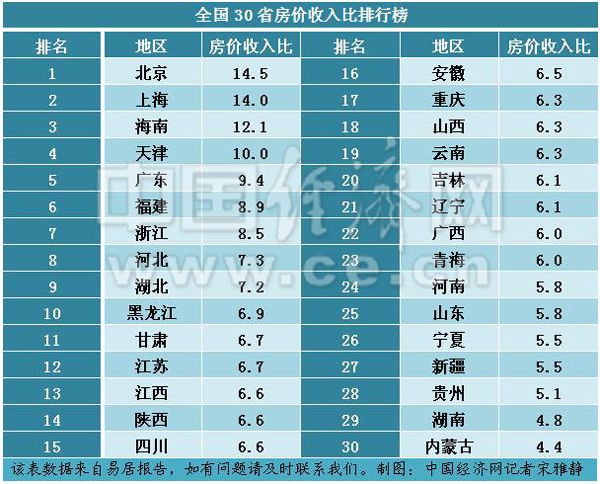
Chinese economy Beijing, May 12 (reporters Song Yajing) house price-income ratio refers to the ratio of housing price to household income, reflecting the ease with which we purchase, also reflects the real estate bubble. It was easy to report the latest data shows that 2015 national housing price-income ratio of 7.2, which Beijing housing price-income ratio of 14.5, ranked first in the country for three consecutive years, becoming the country's home buyers the most difficult city, Inner Mongolia is still the highest in the last one, only 4.4.
Judging from China's economic development in the first quarter, is expected in 2016 house price-income ratio is still up slightly, and made in China economic net 30, house price-income ratio table, house price-income ratio such as Beijing, Shanghai, Hainan is huge, and there are people who just want need, buying pressure will increase again.
What is the price to income ratio? Count your buyers how much difficulty
Purchase intentions of people when faced with higher prices, often exclaimed to earn enough money to buy a house through the House price-income ratio, we can calculate the difficulty of a family house of science. House price-income ratio refers to the ratio of housing price to household income, different organizations might have different indicators and different calculation methods, a national average house price to income ratio is commonly used household average income and the high price ratio to calculate the average price of a House, namely: House price-income ratio = housing ÷ the total household annual income per household.
According to the China economic net reporter, the reported data are from the national statistical offices, the local Bureau of statistics official data, housing in particular to new homes, not including housing. In 96 regions in the country, the maximum is 30, the lowest is 0.8, an average of 8.4 and 6.4 per cent of the median. Generally speaking, in developed countries, house price-income ratio exceeding 6 can be considered bubble territory. According to China's reality, e-House report says China's house price-income ratio remained at 6-7 is a reasonable interval.
National housing price-income ratio of 7.2
According to the national statistical office-caliber data, in 2015, the per capita disposable income of urban residents last year (in nominal terms) grew 8.2% in 2014, a nominal increase of narrow 0.8%, allowing for price factors, an increase of 6.6% new housing price growth of 9.1% (contains type sold affordable housing and shelters to houses), an increase of 7.7% larger than 2014, rising prices appear to be significant. This report House price-income ratio "type area" indicators, unified in a 100 sq m (similar to the national urban average housing area).
According to the price-income ratio formula come 2015 national housing price-income ratio of 7.2. From the perspective of the absolute level of house price-income ratio still belongs at 6-7 reasonable shocks within a reasonable range. House price-income ratio upside was mainly influenced by 2015 in first-tier cities and focused on second-tier cities rising warmer housing prices increase significantly, while income growth is less than the impact of price increases.
Differentiation of 30 provincial house price-income ratio significantly 7 provinces and cities nationwide house price-income exceed 8.5
Ranking for three consecutive years to buy a house in Beijing the first difficulty ratio maintained 14.5 high
According to reports, in 2015, the differentiation of 30 provinces of the country housing price-income ratio is still apparent, the highest for three consecutive years, Beijing maintained at a high of 14.5, while Inner Mongolia is still the last person, only 4.4, compared with 2014 fell 0.3. Overall, Beijing, Tianjin, Shanghai, Hainan, Guangdong, Fujian and Zhejiang, 7 provinces and high house price-income ratio (more than 8.5), as a key tourism provinces of Hainan, the majority of commercial housing sold outside the island, housing price-income ratio is second only to Beijing and Shanghai, there is a certain particularity, the rest being eastern coastal provinces and cities.
In addition, the country's 22 provinces (autonomous regions) house price-income ratio lower than the average of 7.3 30 provinces of the country, including 11 Western provinces (autonomous regions), 8 3 Eastern and central provinces provinces. Shows that housing prices in China have significant regional disparities.
In 2015, 11 in the eastern provinces (municipalities), the House price-income ratio to 14.5 ranked first again in Beijing, Shanghai, Tianjin, Guangdong, Hainan, Fujian, Zhejiang 6 followed by high house price-income areas, Hebei, Shandong, Jiangsu, Liaoning, house price-income ratio is relatively low.
8 provinces in the central region house price-income ratio in China's 30 provinces (municipalities and autonomous regions) is below average. From apartment sales price, the central region are in the lower-middle level, smaller gaps between provinces.
House price-income ratio in 11 provinces in the Western region, are lower than the average level of 30 provinces of the country, and has 9 provinces and fell. From apartment sales price, are generally lower than the national average in the West, there is a certain gap between, including Shaanxi, Sichuan, Chongqing commercial housing sales price is relatively high, minimum of Guizhou province.
2016 house price-income ratio is still up slightly
Analysis from the level of demand for residential home, only commensurate with the level of local residents ' income and ability to pay prices are reasonable price level, this is known as the price-income ratio concept.
According to the China economic net reporter, opened in 2016 years, the real estate market continued the 2015 year bottoming pattern, national real estate investment 1.7677 trillion yuan in the first quarter, compared with nominal growth 6.2% growth year speed up 5.2% over the previous year; national commercial housing sales 1.8524 trillion yuan, an increase of 54.1%, in which housing sales increased by 60.3%. In addition, e-house research data show that the first quarter of 2016, national housing prices grew 18.3%, sales rose 35.6%. Visible, so far from a rebound in the property market in 2015, national commercial house appeared more substantial "price-volume Qi Sheng", for some time to come will further rise of inertia.
In terms of per capita income, according to the Bureau of statistics in the first quarter, urban residents ' per capita disposable income of 9255, an increase of 8%. Because of the GDP increase will be less than the same period in 2015, so income growth will also synchronize shrink, e-House Research Institute analysis is expected in 2016 national per capita disposable income of urban residents increased by about 8%.
E-House report argues that in 2016 in 30 provinces (municipalities and autonomous regions) generally slightly higher house price-income ratio in 2015; eastern coastal provinces and cities housing price-income ratio will continue to rise, falling house price-income ratio in the Western region will slow down.
Responsible editor: Wang Hao
Article keywords:National Beijing
I want feedback
Save a Web page
China economic NET
全国各省份购房难度排名出炉 北京连续三年居首|全国|北京_新闻资讯
原标题:30省房价收入比排行出炉 各地真实购房难度大起底
中国经济网北京5月12日讯(记者 宋雅静)房价收入比是指房屋总价与居民家庭年收入的比值,反应了我们购房的难易程度,也折射出房地产行业的泡沫。据易居报告最新数据显示,2015年全国商品住宅房价收入比为7.2,其中北京房价收入比14.5,连续三年位列全国第一,成为全国购房难度最高的城市,内蒙古依旧位居最后一名,仅4.4。
从我国一季度经济发展情况来看,预计2016年房价收入比仍或小幅攀升,在中国经济网制作的30省房价收入比排行榜中,像北京、上海、海南这种房价收入比巨大,且又有刚需需求的市民来讲,购房压力将再次加大。
什么是房价收入比?算算你的购房难度究竟有多大
有购房意向的群众面对高昂的房价时,常会惊呼赚的钱不够买房子,通过房价收入比,我们可以科学的计算出一个家庭购房的难度。房价收入比是指房屋总价与居民家庭年收入的比值,不同机构可能采用不同的统计指标和不同的计算方法,一个国家的平均房价收入比通常用家庭年平均总收入与高房价一套房屋的平均价格之比来计算,即:房价收入比=每户住房总价÷每户家庭年总收入。
据中国经济网记者了解,此次易居报告数据皆来自于国家统计局、地方统计局的官方数据,其中商品住宅特指一手房,不包括二手房。在全国96个地区中,最高的为30,最低的为0.8,平均值为8.4,中位数为6.4。一般而言,在发达国家,房价收入比超过6就可视为泡沫区。根据我国实际情况,易居报告认为我国房价收入比保持在6-7属合理区间。
全国商品住宅房价收入比为7.2
根据国家统计局口径的数据,2015年,城镇居民人均可支配收入比上年(名义)增长8.2%,比2014年名义增幅收窄了0.8个百分点,扣除价格因素,实际增长6.6%;新建商品住宅价格增长为9.1%(包含有可售型保障房和棚改房), 增幅比2014年扩大7.7个百分点,房价涨幅出现较为明显的攀升。本报告中房价收入比的“户型面积”指标,统一按照100平方米计算(与全国城镇家庭平均住房面积相近)。
根据房价收入比计算公式,得出2015年全国商品住宅房价收入比为7.2。从房价收入比的绝对水平看,仍然属于在6-7的合理区间内合理震荡。房价收入比的上行主要是受2015年一线城市和重点二线城市房市回暖导致房价增幅明显攀升,同时收入增幅远小于房价增幅的影响。
全国30省房价收入比分化明显 7省市房价收入超8.5
北京连续三年位居全国买房第一难 比值维持14.5高位
据易居报告显示,2015年,全国30省商品住宅房价收入比分化依然明显,最高的北京市连续三年维持在14.5的高位,而内蒙古仍然是最后一名,仅4.4,与2014年相比下降0.3。整体而言,北京、上海、海南、天津、广东、福建和浙江7个省市房价收入比较高(超过8.5),海南作为全国重点旅游省份,大部分商品房卖给了岛外人,房价收入比仅次于北京和上海,有一定特殊性,其余为东部沿海省市。
此外,全国22个省份(自治区)房价收入比低于全国30省的平均水平7.3,包括11个西部省(自治区)、8个中部省份和3个东部省份。可见,我国房价具有明显的区域差距。
2015年,东部地区11个省(市)中,北京房价收入比以14.5再次位列第一,上海、海南、天津、广东、福建、浙江6个高房价收入地区紧随其后,河北、江苏、辽宁、山东房价收入比相对较低。
中部地区8个省份房价收入比均在全国30个省(市、自治区)平均水平以下。从商品住宅销售均价来看,中部地区均处于中等偏下水平,各省之间差距较小。
西部地区11省份房价收入比,均低于全国30省平均水平,且有9个省市地区同比下跌。从商品住宅销售均价来看,西部地区普遍低于全国平均水平,各地之间有一定的差距,其中陕西、四川、重庆商品住宅销售均价相对较高,贵州最低。
2016年房价收入比仍或小幅攀升
从住宅自住需求层面分析,只有与当地居民收入水平和支付能力相适应的房价,才是合理的房价水平,这正是所谓的房价收入比的概念。
据中国经济网记者了解,2016年开年以来,房地产市场延续了2015年触底反弹的格局,第一季度全国房地产开发投资17677亿元,同比名义增长6.2%,增速比上年全年加快5.2个百分点;全国商品房销售额18524亿元,同比增长54.1%,其中住宅销售额增长60.3%。此外,据易居研究数据显示,2016年第一季度,全国商品住宅成交均价同比增长18.3%,销售面积同比增长35.6%。可见,从2015年楼市反弹至今,全国商品住宅出现了较大幅度的“量价齐升”,未来一段时间将进一步惯性上涨。
在人均收入方面,据国家统计局数据显示,第一季度,全国城镇居民人均可支配收入9255元,同比增长8.0%。由于GDP增幅会小于2015年同期,所以居民收入增幅也会同步缩小,易居研究院分析预计2016年全国城镇居民人均可支配收入增长8%左右。
易居报告认为, 2016年全国30省(市、自治区)房价收入比将总体略高于2015年;东部沿海省市房价收入比将继续攀升,西部地区房价收入比下滑态势将趋缓。
责任编辑:王浩成
文章关键词: 全国 北京
我要反馈
保存网页
中国经济网